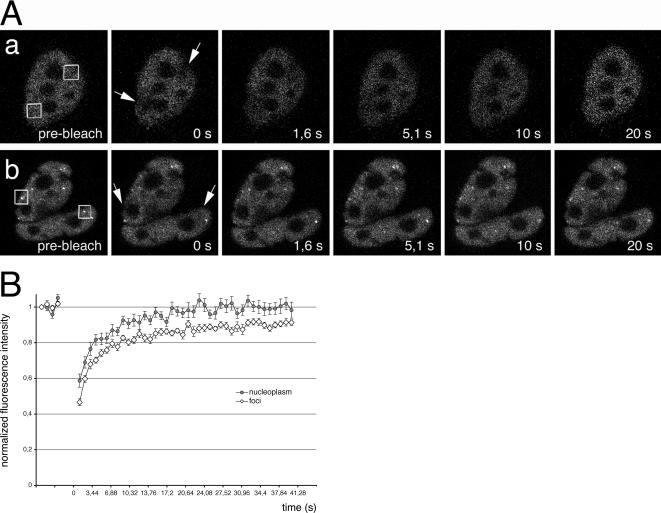
Figure 9.
Recovery of GFP-CF Im68 fluorescence after photobleaching in living cells. (A) Cells expressing GFP-CF Im68 were imaged before or after bleaching of a nucleoplasmic area (top row) or of paraspeckles (bottom row). Images were taken at the indicated times after the bleach pulse. The area of the bleach spot is indicated with a square. a, FRAP of nucleoplasmic regions. b, FRAP of paraspeckles. Bar, 5 μm. (B) Kinetics of recovery after spot bleaching of a nucleoplasmic region (closed circles) and of a paraspeckle (open diamonds). Recovery curves are plotted as normalized fluorescence intensity versus time. Each point is the mean value from eight cells. The error bars indicate the SD.

