
Fig. 1.
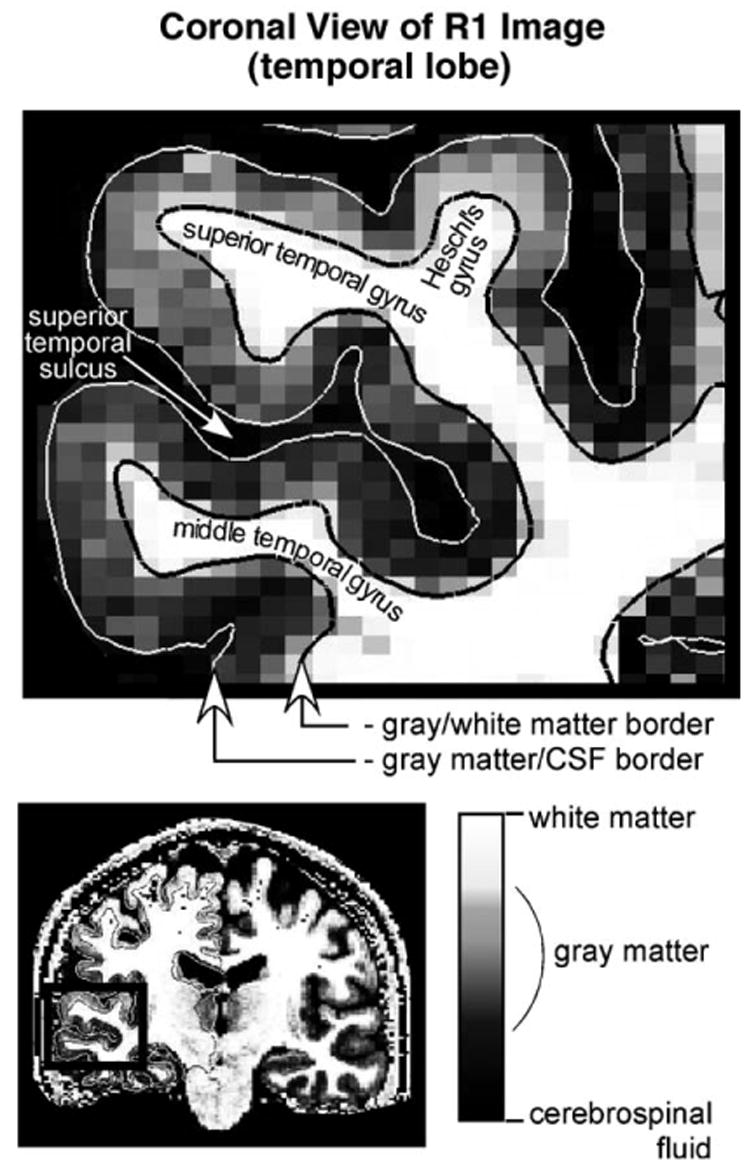
Coronal slice through the temporal lobe showing the spatial distribution of R1 at the resolution of the original images (1.3 × 1 × 1.3 mm). The grayscale value for each pixel indicates the magnitude of R1. White and black lines indicate the gray matter/CSF and gray matter/white matter borders, respectively, as determined by the segmentation procedure.