
FIG. 10.
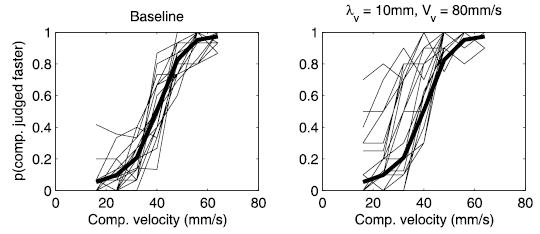
Psychometric functions obtained from individual subjects in experiment 1. Left: baseline TSD performance; right: performance in the presence of a 10-mm, 80-mm/s visual distractor. The dark traces show the baseline condition averaged across subjects. Most of the functions in the experimental condition fall to the left of the mean baseline performance, suggesting some degree of bias in most subjects. For some subjects, the bias was much larger in magnitude than for others.