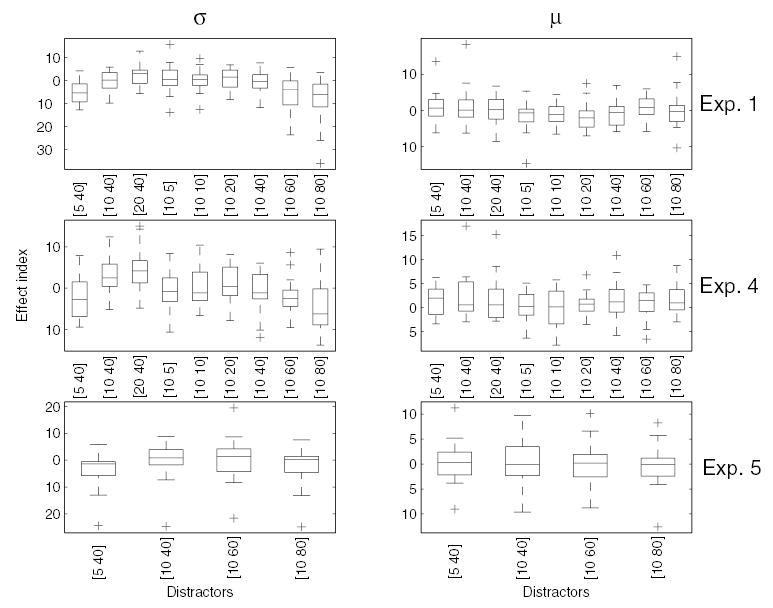
FIG. 11.

Summary of the effects of the visual distractors on TSD in experiments 1, 4, and 5. The ‘effect index’ denotes the value of the psychometric parameter—σ or μ— obtained in the experimental condition minus that obtained in the control condition. Changes in μ suggest a perceptual bias, changes in σ point to a change in the discriminability of the stimuli. The parameters of the visual distractors are shown beneath each plot: [spatial period (mm) drift speed (mm/s)]. The box plots show the median (interior line) and upper and lower quartiles. The whiskers show the range of the data without outliers (>1 interquartile range from median). An outlier is denoted by a plus. The effect of the visual distractors varied considerably across subjects: Some subjects showed no effect whereas, for other subjects, TSD judgments were almost completely “captured” by the visual distractor.
