
FIG. 2.
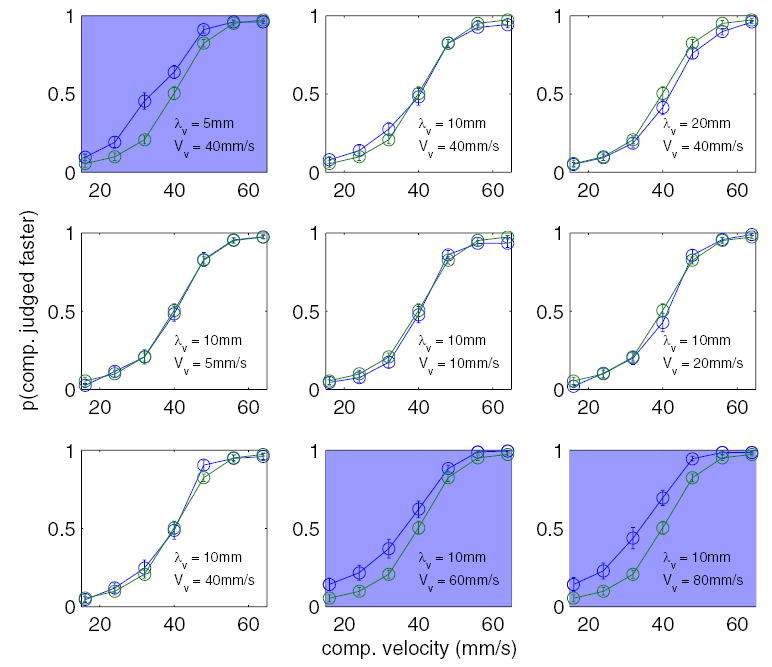
Experiment 1: effect of a visual distractor on tactile speed discrimination. Each plot shows the proportion of times the comparison (λt = 8 mm) was judged to be faster than the standard (λt = 8 mm, Vt = 40 mm/s) as a function of the drift speed of the comparison. The blue trace shows the subjects’ performance in the presence of a visual distractor, the parameters of which are indicated in the bottom right of each subplot, presented at the same time as the comparison stimulus. The green trace shows baseline performance in the absence of a distractor. Plots shaded in blue show conditions in which the visual distractor significantly increased the perceived speed of the tactile comparison stimulus. Error bars represent ±1 SE.