
Figure 7.
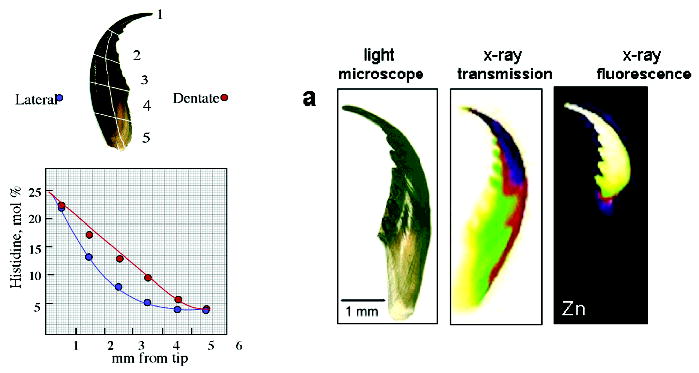
Gradients in the tip-to-base histidine and zinc distribution of a Nereis jaw (from ref 45). The left panel shows a sketch of a Nereis jaw sectioned for amino acid analysis (top) and the decrease of histidine content (bottom) from ~22 mol % at the tip to 5 mol % at the base and lateral to serrated side of the Nereis jaw. The right panel shows the Zn-fluorescence mapping with synchrotron radiation. Images from left to right display a light microscopic image of intact Nereis jaw, an X-ray absorption image (the dark region at the tip denotes greater absorption), and an X-ray fluorescence image (lighter colors indicate greater amount of Zn).