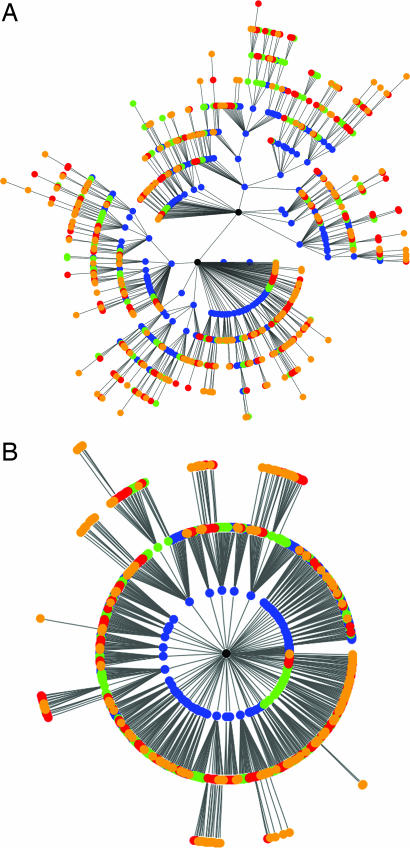
Fig. 3.
Comparison of PA and TPA graphs. Both graphs are grown to n = 1,000 nodes. The oldest N/4 nodes are colored blue, the next quarter green, then red, and finally orange. (A) PA graph. (B) TPA with A1 = 17, A2 = 10, thus γ = 1.83. Note the effects of aging in TPA; in contrast to PA, very few of the newest nodes attach to the root. Also, due to the minimization of hop-count, the diameter of the TPA graph is much smaller than that of the PA graph. By varying the choice of parameters A1 and A2, it is possible to achieve graphs of appearance intermediate between A and B, or even more extreme than B with respect to the diameter and the number of new nodes attaching to the root.

