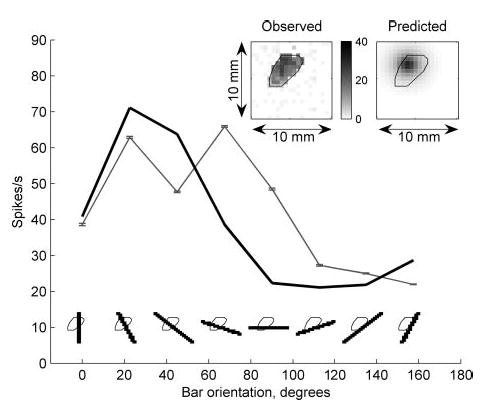
Fig. 8.

Responses of the RA unit (p4b_06_03) to bars and punctate probes together with model predictions from relative change in area. Predictions were obtained using the responses to indented spheres. Conventions as in Fig. 5. Correlation = 0.91 and 0.80 for bars and punctate probes, respectively.
