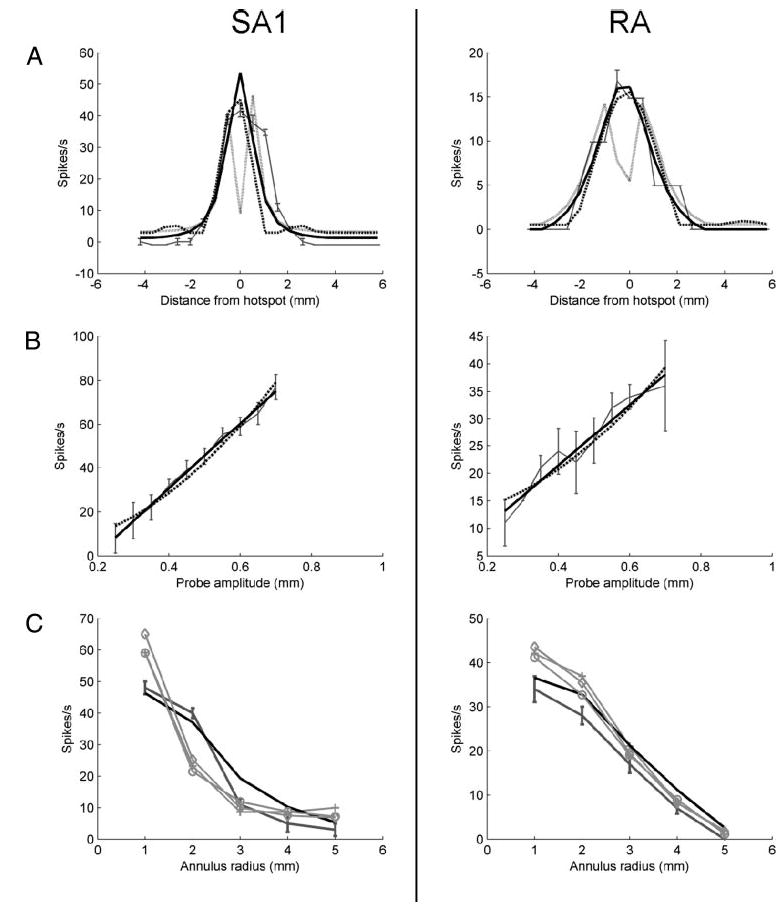
Fig. 9.

A, left: cross-section of the observed spatial response map of SA1 unit p4b_11_00 using punctate probe indentations (dark gray). Response map predictions using receptor location fitted from the spherical data are shown for maximum horizontal strain (light gray, solid), maximum horizontal stress (dashed), and maximum tensile strain (thick black line, solid). Right: corresponding plot for RA unit p4b_13_00. The thick black line indicates predictions obtained using relative change in area. B, left: response of SA1 unit p4b_25_01 as a function of the amplitude of a punctate probe indented at the center of the receptive field. Observed response is shown in dark gray; error bars denote SE. Predicted responses using maximum tensile strain and relative change in volume are shown as solid and dotted lines, respectively. Right: corresponding plot for RA unit p4b_19_01. Solid and dotted lines indicate relative change in area and relative change in volume, respectively. Both strain energy density and relative change in volume were quadratic functions of probe amplitude. C, left: responses of SA1 unit p4b_11_00 to indented annuli of increasing radius. Afferent response is shown in dark gray; error bars denote SE. Predicted responses: thick black, maximum tensile strain; gray crosses, vertical strain; gray circles, mean strain; gray diamonds, vertical stress. Right: responses of RA unit p4b_19_01 to indented annuli (dark gray with error bars), with predicted responses using relative change in area (black), vertical strain (crosses), mean strain (circles), vertical stress (diamonds).
