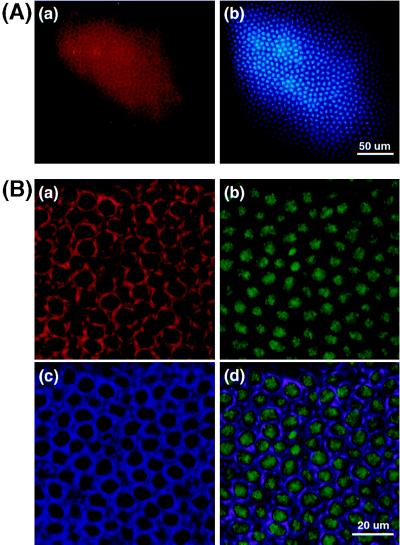
Figure 4.
Cellular distribution of DmMTR1 in Drosophila embryos at interphase. (A) Low magnification picture of a stage 14 embryo at interphase. (a) DmMTR1 (red) recognized by anti-RI; (b) DNA (blue) stained with Hoechst 33258. (B) High magnification of a stage 13 embryo at interphase. (a) DmMTR1 (red) recognized by anti-RIV; (b) DNA (green) stained with sytox; (c) α-tubulin (blue) recognized by monoclonal anti-α-tubulin antibody; (d) a merged image of DmMTR1, DNA, and α-tubulin.

