
Figure 3.
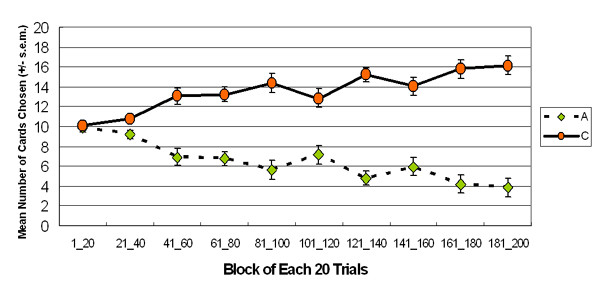
Mean number of cards selection in blocks. The 2-stage preference curves of decks A and C. Participants preferred deck C to deck A at the beginning and this choice pattern lasted until the end of stage 2.
Official websites use .gov
A
.gov website belongs to an official
government organization in the United States.
Secure .gov websites use HTTPS
A lock (
) or https:// means you've safely
connected to the .gov website. Share sensitive
information only on official, secure websites.
Mean number of cards selection in blocks. The 2-stage preference curves of decks A and C. Participants preferred deck C to deck A at the beginning and this choice pattern lasted until the end of stage 2.