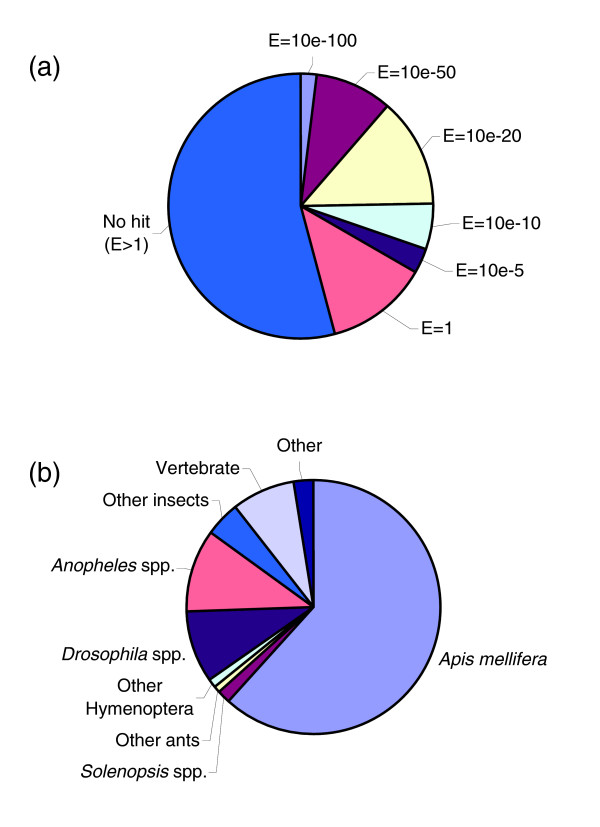
Figure 1.

Sequence analysis by blastx searches. (a) Percentage of fire ant assembled sequences with and without blastx matches at various E-value cutoffs. (b) Quantitative overview of organisms providing the best-matching homologous protein sequences to fire ant assembled sequences (E ≤ 1e-5).
