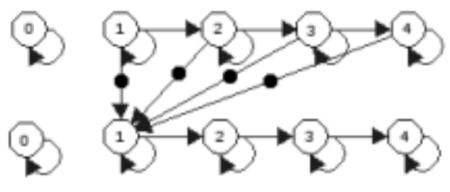
Figure 1.
A diagram of two positions of the Markov model used in the model. Each edge represents a transition probability from one state of growth to another while each dotted edge represents an ‘output’ probability of metastasis, which affects the probability of the next position’s distribution being in state 1.

