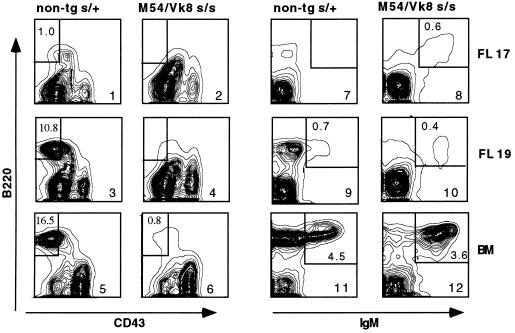
Figure 5.
Development of B cells in fetal liver (FL) of M54/Vκ8 SCID embryos. Flow cytometric contour plots on the left show B220 versus CD43 staining on IgM− gated cells and, on the right, B220 versus IgM staining on CD43− gated cells. The percentage of pre-B (B220+CD43−) or B (B220+IgM+) cells is indicated in the boxed areas.

