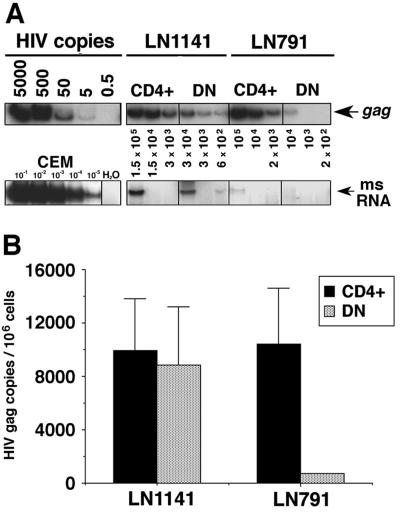
Figure 3.
HIV DNA in T cell subsets from LN. (A) Gag DNA PCR was performed on isolated CD4 and DN subsets from two LN. ACH-2 cell equivalents were used as an indicator of HIV-1 DNA copy numbers, and PCR substrate DNA from the LN subsets was diluted, as indicated by the cell number equivalents. cDNA templates were used for the MS RNA reverse transcription–PCR (RT-PCR) as described (7). The CEM cell line infected with HIV NL4.3 was used as a control for the specificity of the MS PCR with indicated dilutions starting at approximately 105 cell equivalents for the far left lane. (B) HIV gag DNA copy numbers per million cells were assessed as described for Fig. 2B by extrapolation on to a standard curve obtained from the ACH-2 dilutions. For each subset, three readings were taken by using the band intensities of the three dilutions, and these readings were used to calculate means ± SD.

