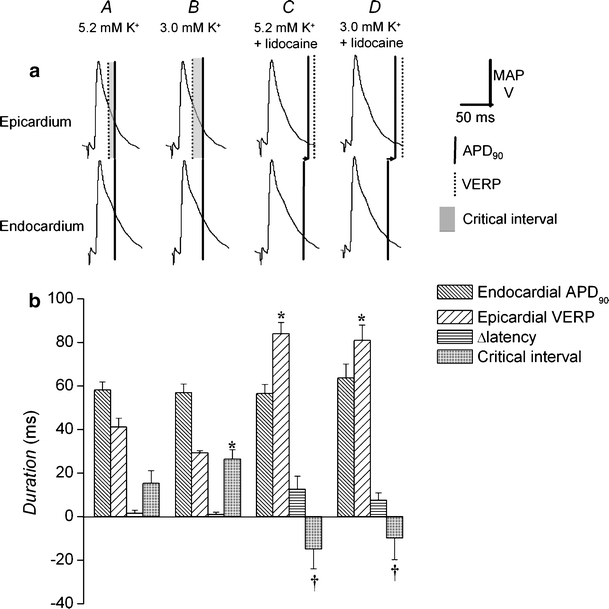
Fig. 6.

Changes in endocardial action potential duration, epicardial ventricular effective refractory period, transmural conduction time, and epicardial transmural critical interval after exposure to hypokalemia and to lidocaine. Epicardial and endocardial MAP morphologies during regular stimulation cross-comparing epicardial and endocardial waveforms and the relationship between the action potential duration at 90% repolarization; APD90 (vertical solid lines) and VERP (vertical broken lines) of one waveform and the decay of the other, indicating critical intervals (shading). Hearts were exposed to normokalemic (5.2 mM K+, A) and hypokalemic (3.0 mM K+, B) test solutions and normokalemic (C) and hypokalemic (D) test solutions containing lidocaine (10 μM) for 20 min. Horizontal arrows indicate the time taken for depolarization to spread from epicardium to endocardium (a). APD90 (dense hashing), VERP (sparse hashing), transmural conduction time (horizontal hashing), and critical interval (shading) under these conditions (b). Asterisks indicate values that are significantly (P < 0.05) larger, and daggers those that are smaller than those recorded in normokalemic hearts
