
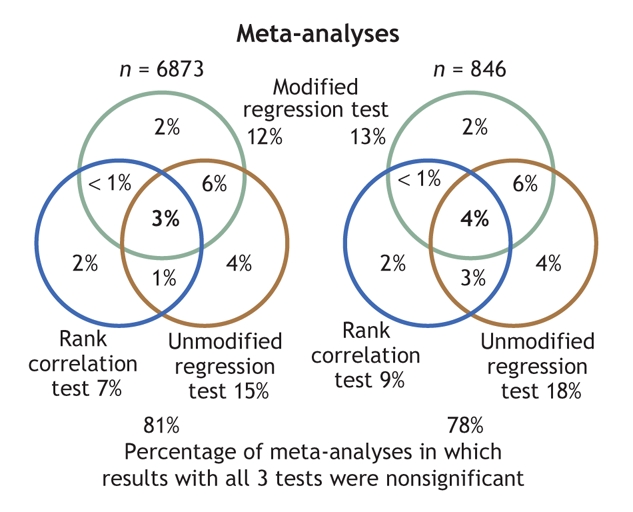
Fig. 2: Venn diagrams disclosing modest concordance in the application of the 3 funnel-plot asymmetry tests to statistically significant results in the wider data set of 6873 meta-analyses (left) and in the restricted data set of 846 meta-analyses (right). Data inside the circles refer only to meta-analyses with significant results with the corresponding test (p < 0.10).