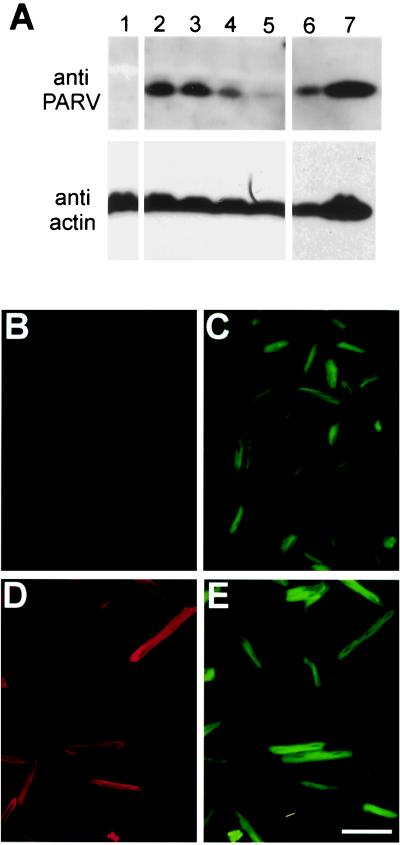
Figure 1.
Parvalbumin expression in adult cardiac myocytes after AdαParv gene transfer. (A) Western blot showing parvalbumin expression in cardiac myocytes. Lane 1: control. Lanes 2–5: dose response with 500, 150, 50, and 15 mois AdαParv. Lanes 6 and7: superior vastus lateralis at two dilutions. Relative loading indicated by stripping and reprobing blots with actin antibody. (B–E) Indirect immunofluorescence of control myocytes (B and C) and myocytes treated with AdαParv at 500 mois (D and E). Cells have been stained with anti-parvalbumin followed by goat anti-mouse IgG-Texas Red secondary antibody (B and D). FITC phalloidin was used to visualize actin (C and E). (Scale bar = 100 μm.)

