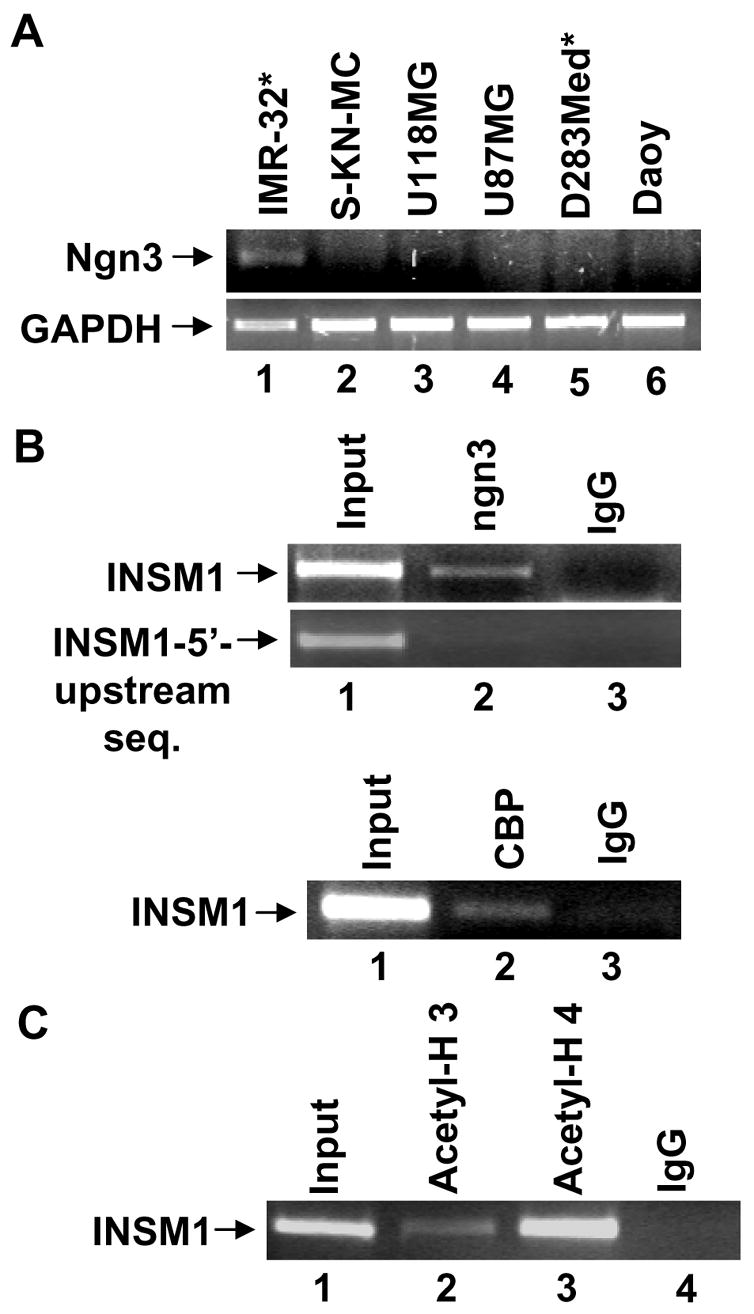
Figure 3.

RT-PCR analysis of ngn3, GAPDH, and the ChIP analyses of the endogenous INSM1 promoter. (A) Total RNA was isolated from human neuroblastoma, IMR-32, SK-N-MC, human glioblastoma cells U118MG, U87MG, human medulloblastoma, D283Med, and Daoy using Trizol reagent. Cell lines labeled with * represent the INSM1 expressing cells. IMR-32 cells are positive for ngn3 message. (B) ChIP analyses were performed using a mouse monoclonal anti-ngn3, anti-CBP, anti-acetyl H3/H4, or control IgG antibody with chromatin isolated from IMR-32 cells. Input DNA was included as a positive control (~2.5%) for PCR analysis. The INSM1 promoter region was immunoprecipitated with anti-ngn3, anti-CBP, and anti-acetyl-H3/H4 antibodies but not negative control IgG. Each ChIP experiment was repeated to ensure its reproducibility.
