Figure 3.
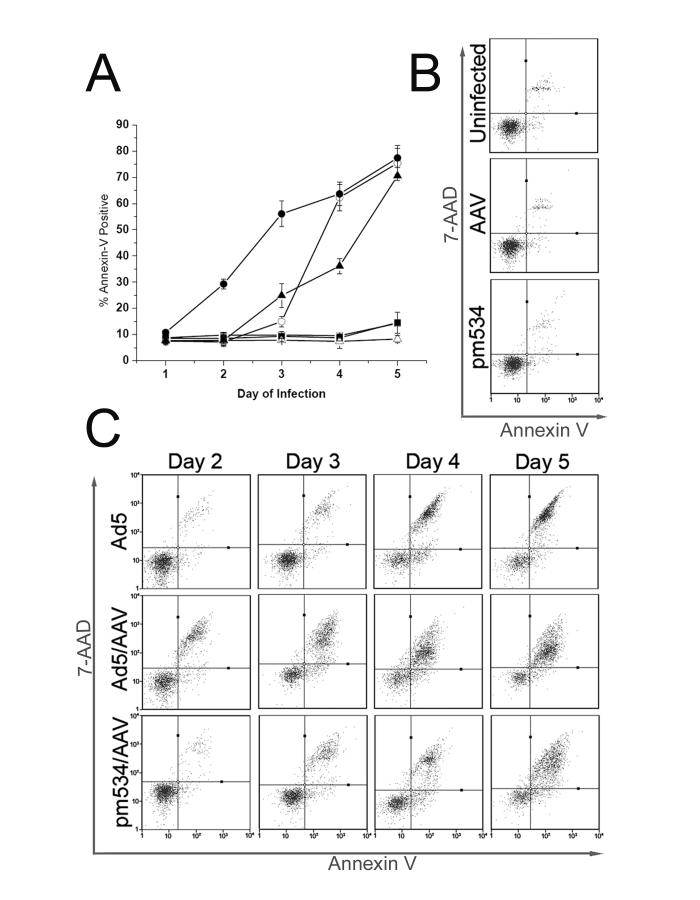
AAV induced apoptosis during coinfection with Ad5 or pm534. Cells were infected, harvested by trypsinization on the indicated day, stained with Annexin V-PE and 7-AAD, and analyzed using the Guava PCA flow cytometer. (A) Time course analysis of Annexin V-PE staining. Flow cytometry results are reported as the percent of Annexin V-PE positive cells (y-axis) on the given day of the infection (x-axis). Ad5-infected cells are depicted as white circles, and Ad5/AAV coinfected cells as black circles. ADP mutant pm534-infected cells are shown as white triangles without AAV and black triangles with AAV. Uninfected cells are depicted by white squares, and AAV-infected cells are represented by black squares. (B) Representative diagrams of Annexin V-PE and 7-AAD staining of uninfected, AAV-infected, and pm534-infected cells. Cells were infected with the virus indicated on the left of each panel and harvested 4 days pi. Fluorescence intensity of Annexin V-PE is represented on the x-axis, and that of 7-AAD is represented on the y-axis. (C) Annexin V-PE and 7-AAD flow cytometry analysis of Ad5-, Ad5/AAV-, and pm534/AAV-infected cells. Cells were harvested between 2-5 days pi, as noted on top of the panels. Fluorescence intensity of Annexin V-PE and 7-AAD are given on the x- and y-axes.

