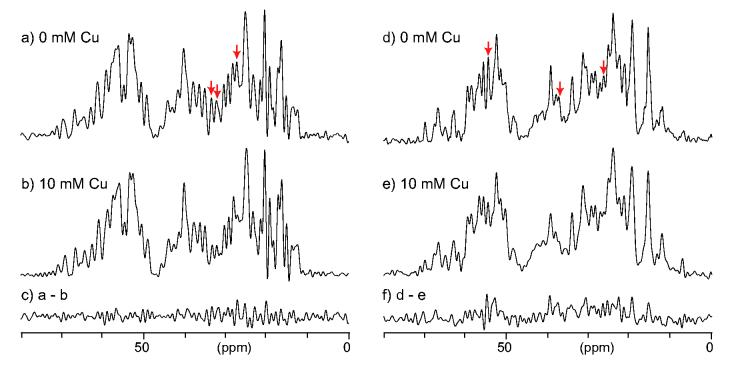
Figure 5.
13C CPMAS spectra of (a, b) lysozyme and (d, e) ubiquitin protein crystals with Cu-EDTA concentrations of (a, d) 0 mM, (b, e) 10 mM. The spectra in (c, f) are the difference between the spectra obtained with and without Cu-EDTA for the same sample. The spectra were obtained at 13C NMR frequency of 100.6 MHz at a spinning speed of 40 kHz with 1H π pulse-train decoupling during the acquisition periods of 10 ms. The shorter acquisition periods were adopted to minimize the noise level for comparison. The recycle delays were (a) 1.50 s, (b) 0.18 s, (d) 2.50 s, and (e) 0.18 s. All the spectra were processed with Gaussian line broadening of 25 Hz.

