
Figure 6. Paf1 Is Required for Normal Nrd1 Association with SNR47.
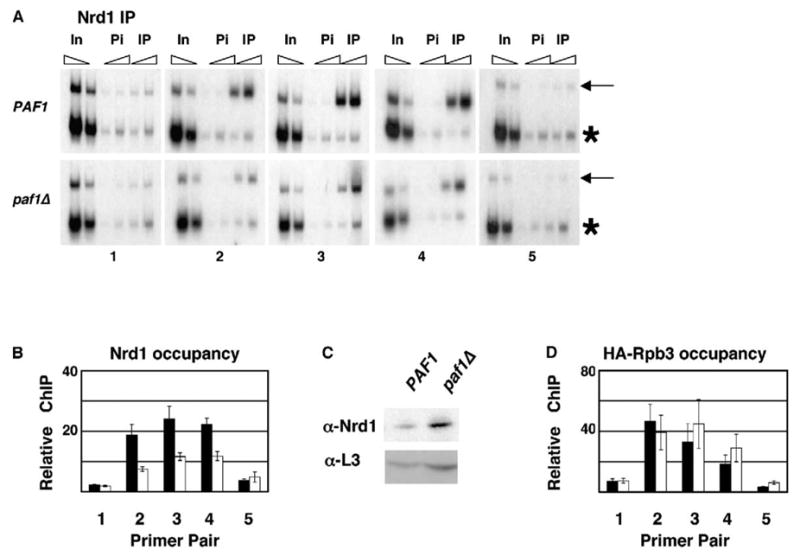
(A) ChIP was performed on chromatin prepared from PAF1 (KKY120) and paf1Δ (KKY122) cells with α-Nrd1 antibody (IP) or preimmune sera (Pi).
(B) Quantitation of three ChIP experiments as in (A). Relative ChIP signals, calculated as in Figure 5, are shown for Nrd1 in the presence (black bars) or absence (white bars) of Paf1.
(C) Protein extracts, prepared from cells grown for ChIP as in (A), were analyzed by immunoblotting with α-Nrd1 and α-L3 antibodies.
(D) ChIP analysis was performed on chromatin from PAF1 HA-RPB3 (GHY645) and paf1Δ HA-RPB3 (KY832) cells. Black and white bars represent average enrichment of HA-Rpb3 in PAF1 and paf1Δ cells, respectively. Untagged control strains (FY118 and KY685) yielded ChIP signals that were near background levels (not shown).
Error bars in (B) and (D) indicate the SEM.