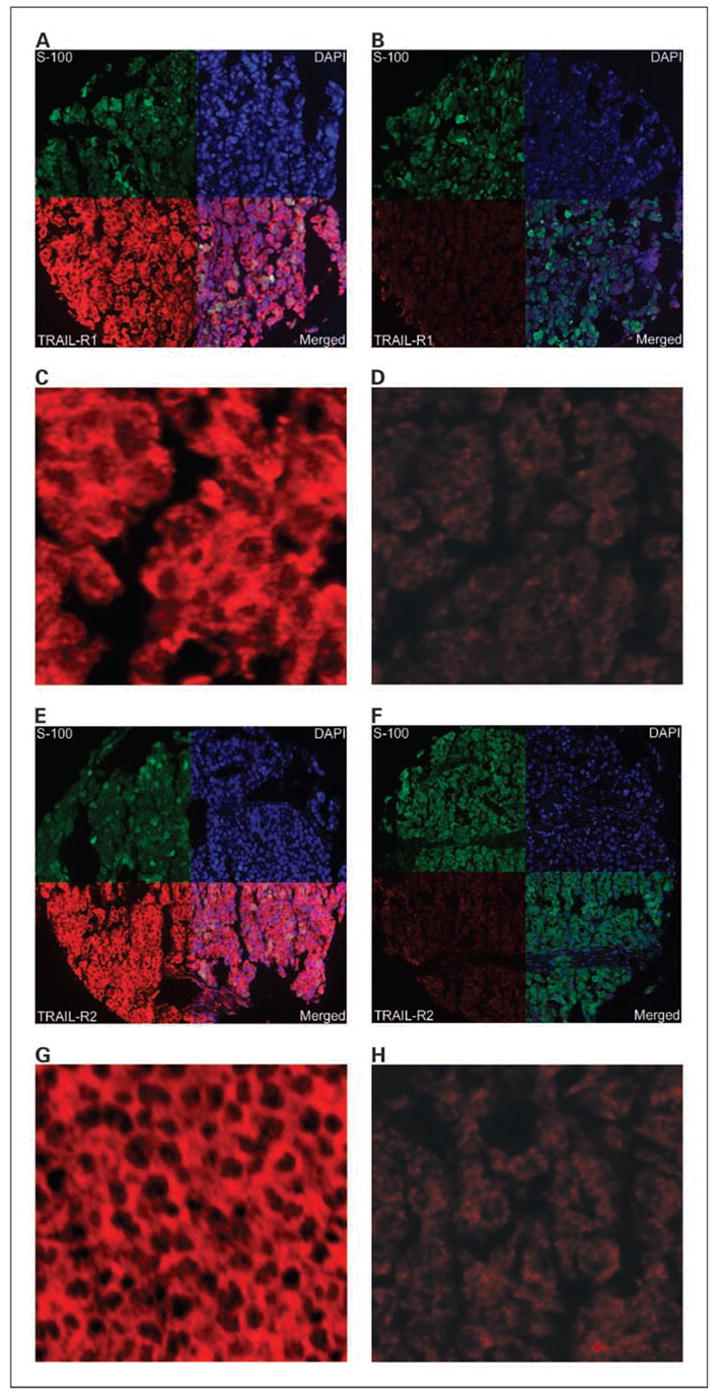
Fig. 2.

Membranous TRAIL-R1 and TRAIL-R2 expression in melanoma histospots using S100 to define the tumor mask (green), 4,6-diamidine-2-phenylindole to define the nuclear compartment (blue), and Cy5 (red) for the target (TRAIL-R1or TRAIL-R2). Merged images (A, B, E, and F, bottom right quadrants) show the amount of target within the nuclear compartment and within the cytoplasmic compartment within the tumor mask. High (A and C) and low (B and D) expression of TRAIL-R1at ×10 and ×60 magnifications, respectively, and high (E and G) and low (F and H) expression of TRAIL-R2 at ×10 and ×60 magnifications, respectively. TRAIL-R1expression in (C and D) corresponds to AQUA scores of 87.01 and 19.171, respectively. TRAIL-R2 expression in (G and H) corresponds to AQUA scores of 78.29 and 13.64, respectively.
