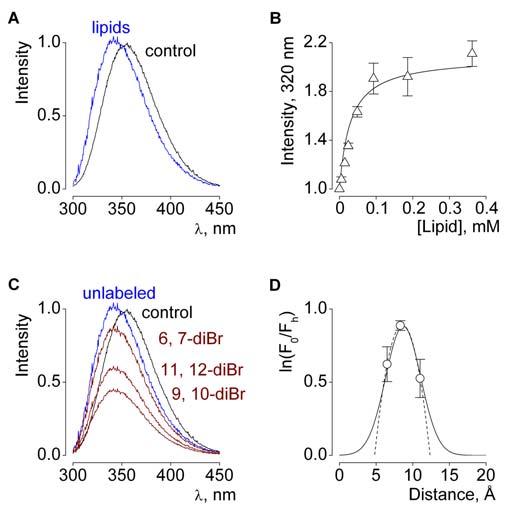
Fig.8.

Membrane partitioning of hanatoxin.
(A) Hanatoxin fluorescence in the absence (black) or presence of vesicles composed of a 1:1 mix of POPC:POPG (blue). Lipid concentration is 1.2 mM and toxin concentration is 2 μM. (B) Fluorescence intensity plotted as a function of available lipid concentration (60% of total lipids) for vesicles containing both POPC:POPG. Smooth curve corresponds to a partition function with a mole fraction partition coefficient (Kx) of 1.8 × 10⁶. (Milescu, M. and Swartz, K.J., unpublished data). (C) Fluorescence emission spectra for hanatoxin in the absence (black) and presence of 1.3 mM lipid vesicles containing unlabeled (blue) or brominated (diBr; maroon) lipids. The 6,7 diBr lipid has Br attached closest to the polar head group. (D) Analysis of the depth-dependent quenching profiles for hanatoxin. Fractional quenching (F0/Fh) by brominated lipids plotted vs average distance of bromine atoms from the center of the bilayer. See (Phillips et al., 2005) for details.
