
Figure 1.
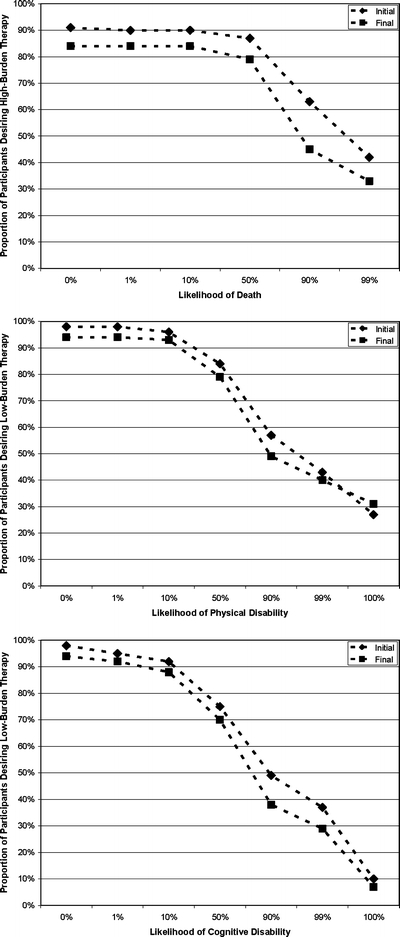
Proportion of participants who were willing to undergo either low- or high-burden therapy at a given likelihood of adverse outcome versus a return to current health. The diamonds represent participants’ responses at the initial interview, and the squares represent participants’ responses at the final interview.