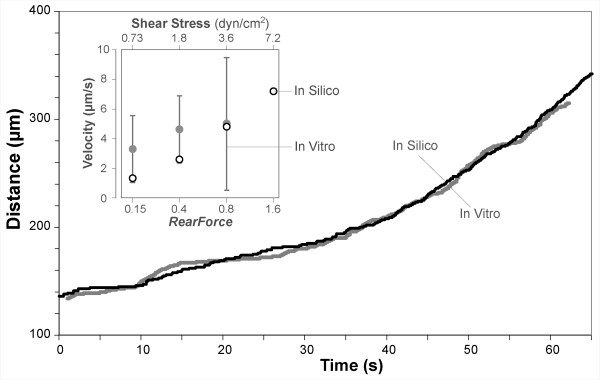
Figure 8.

Simulating experimental condition 2: rolling on VCAM-1 with shear increased at fixed intervals. Alon et al. [17] observed T-lymphocytes rolling on VCAM-1 in the absence of chemokine under increasing wall shear stress; wall shear stress was increased at fixed intervals causing increased leukocyte rolling velocities. Black line: a leukocyte trajectory reported in [17]. Gray line: an example LEUKOCYTE trajectory when using ENVIRONMENT parameter values from Table 5 (part II). Insert: in vitro measures of leukocyte velocity for different values of shear (upper axis); the standard deviations (vertical bars) were conservatively estimated using the standard errors reported in [17]. Circles: average ROLLING velocities of LEUKOCYTES (n = 60) for different RearForce values (lower axis) fall within the in vitro ranges. The original published distance-time plots begin at ~140 microns.
