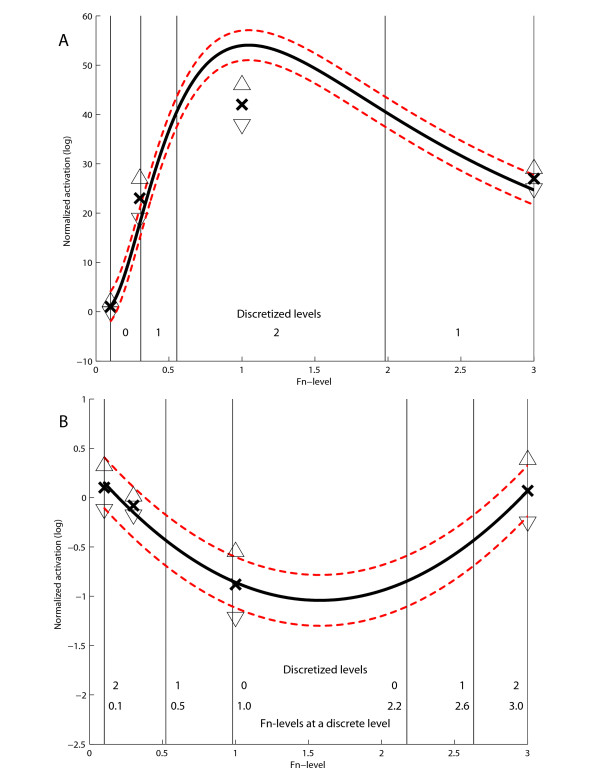
Figure 2.

Polynomial interpolation data for cell speed (A) and activated MLC (B) under EGF stimulation. Crosses are actual measurements, upper and lower triangles are individual standard deviations, red lines denotes squared pooled standard deviation and the vast majority of the simulated cases fall between these lines. Cell speed is biphasic whereas activated MLC is inversely biphasic across fibronectin. Each variable is discretized into low, medium and high in accordance with the degree of polynomial.
