
Figure 3.
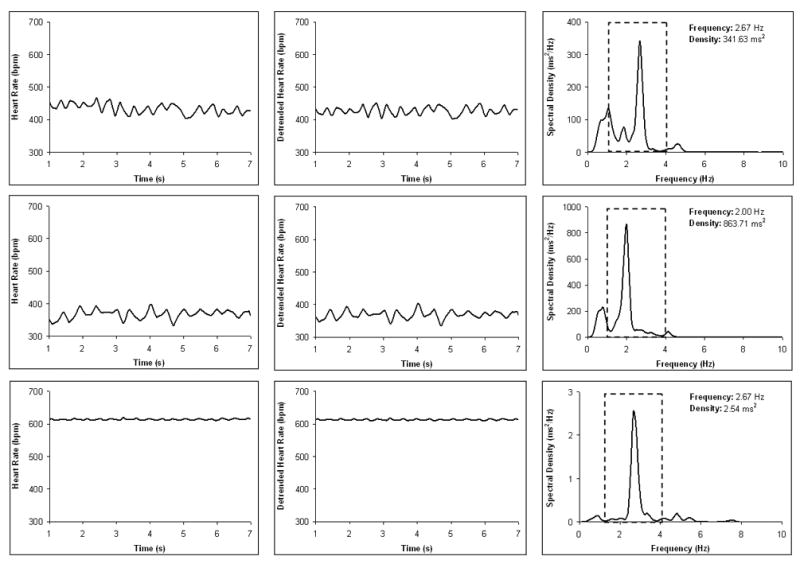
An example from one prairie vole showing time sampled heart rate (Panels A–C), detrended (i.e., cubic moving polynomial) heart rate pattern illustrating respiratory sinus arrhythmia (Panels D–F), and spectral density distribution of the detrended time sampled beat-to-beat heart period data (Panels G–I) during a resting baseline period (Panels A, D, and G) and following atenolol (Panels B, E, and H) and atropine administration (Panels C, F, and I). In Panels G–I, the band of spontaneous breathing in the prairie vole (1–4 Hz) is demarcated with dotted lines, and the peak response within this range is noted. Note the scale differences in Panels G–I.