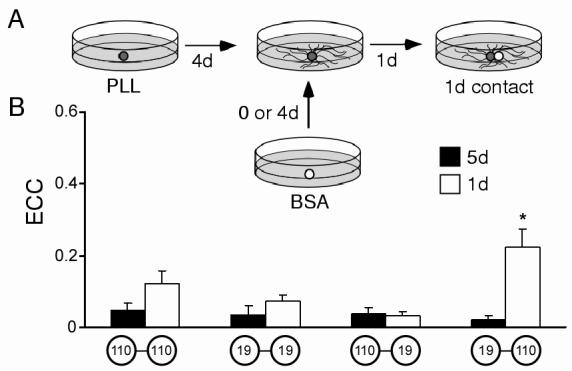
Figure 6.

Effects of cell age on electrical synapse formation. (A) Schematic of the experimental paradigm. Cells were plated onto PLL-coated dishes and allowed to extend processes (dark spheres). On d4, cells were contacted by new somata (white sphere) that had been cultured in separate non-adhesive conditions for either 0 or 4 days. After 24 hours of contact, synaptic connectivity was assessed. (B) Histogram illustrating ECC values for “equally-aged” contacts (5d, solid bars) and “differently-aged” contacts (1d, open bars). 5d pairs were not significantly different (ANOVA, p=0.8; from left to right, 110-110, n=7; 19-19, n=6; 110-19, n=9; 19-110, n=8.) The 1d contact between a 5d 19 and a 1d 110 was significantly different from all other groups (ANOVA (post-hoc LSD), *, p<0.002; 110-110, n=8; 19-19, n=8; 110-19, n=10; 19-110, n=10).
