
Figure 1. Expression of lineage-specific cell surface markers on Myc5 cells following polyclonal stimulation.
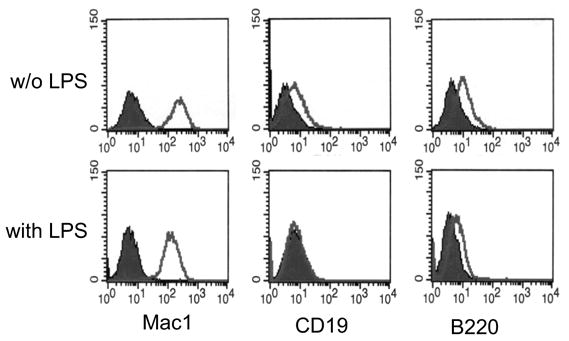
The top and bottom rows represent cells cultured without and with LPS, respectively. Individual panels represent stainings for Mac1, CD19, and B220 antigens, followed by flow cytometry. Filled and open plots represent unstained and antibody-stained cells, respectively.