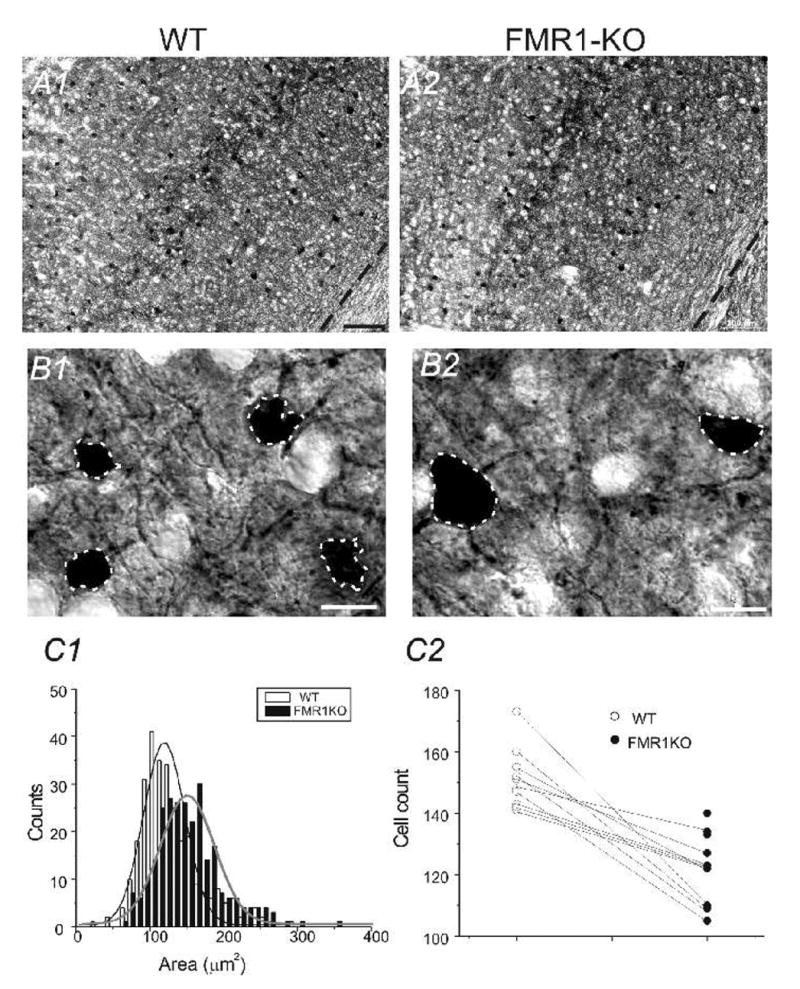
Fig. 2.

A) TC section through somatosensory cortex stained with PV antibodies. Scale bar = 100 μm. A1) WT brain A2) FMR1-KO brain; B) High resolution micrograph image of PV positive neurons and processes. B1) WT brain B2) FMR1-KO brain. Scale bars = 6 μm. C1) Histogram of distribution of PV cell areas in 4 WT mice vs. 4 FMR1-KO mice. C2) The number of PV-positive cells in 10 different TC sections (0.6 mm2 per section) from 4 WT and 4 littermate FMR1KO mice.
