
Figure 1. Relative activity in visual cortex correlates with subjective vividness rating.
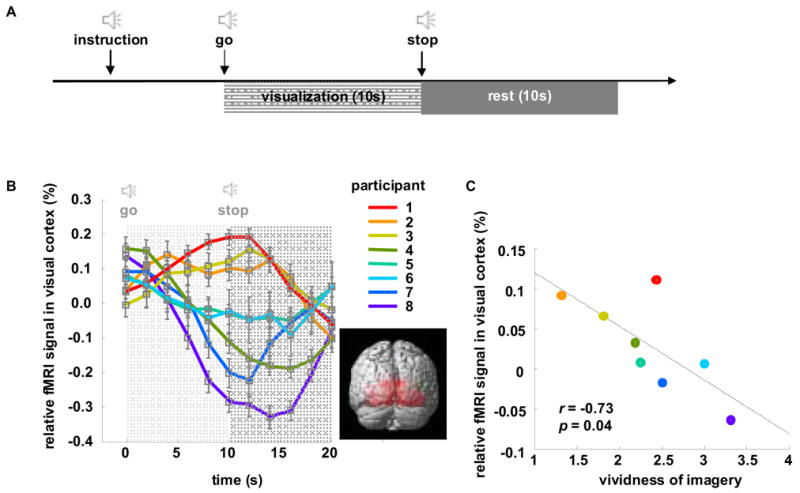
(A) Timeline of the visualization task. Participants began to visualize upon hearing the ‘go’ signal, and stopped visualization upon hearing the ‘stop’ signal, resulting a 10-second visualization phase and 10-second rest phase. All instructions are auditory. (B) Time course of the relative fMRI signal in visual cortex for 8 participants. Relative fMRI is taken as the BOLD signal in early visual cortex (Brodmann’s areas 17 and 18, illustrated in inset) minus the BOLD signal measured over all of gray matter. For plotting purposes, participants are ordered by their relative visual cortex activity averaged over the visualization window of 0 – 10 sec. The negative signal for some subjects is due in part to the subtraction of the whole brain activity – i.e., other regions can increase more than the visual cortex during the time window. (C) The relative visual cortex signal averaged over the visualization window correlates significantly with the subjective rating of vividness (p=0.04).