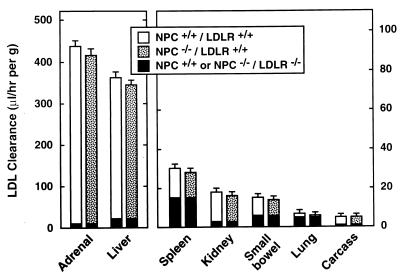
Figure 2.
Total and LDLR-independent LDL clearance in all organs of control mice and animals lacking functional NPC1 and/or LDLR activity. Mice of the four different genotypes (Table 2) were used in these studies and were 7 weeks of age. The height of each bar represents the rate of total LDL clearance per gram of tissue while the lower, black part of each column represents the LDLR-independent component of this clearance that was measured in the NPC+/+/LDLR−/− and NPC−/−/LDLR−/− animals. The “carcass” represents all residual tissues in the animal after removal of the other, identified organs. There were 6–11 mice in each group. There were no significant differences among the values in any organ.

