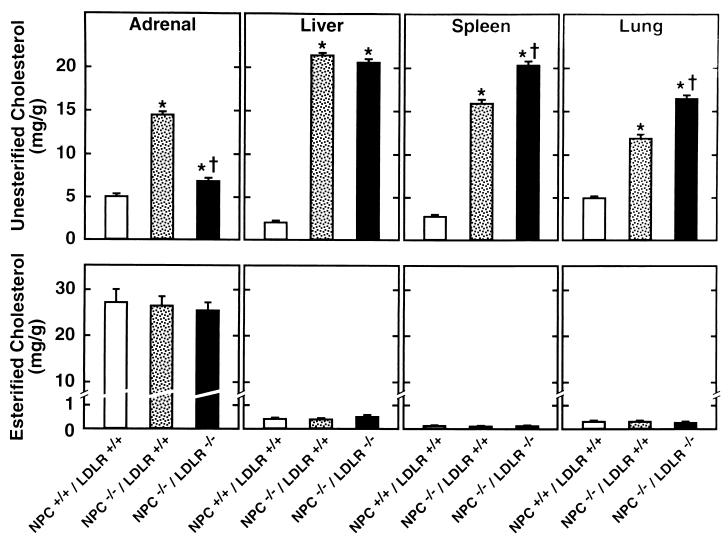
Figure 3.
Tissue concentrations of unesterified (upper panels) and esterified (lower panels) cholesterol in NPC+/+/LDLR+/+, NPC−/−/LDLR+/+, and NPC−/−/LDLR−/− mice 7 weeks of age. There were 6–10 animals in each group. The asterisk (∗) identifies those values in the NPC−/−/LDLR+/+ and NPC−/−/LDLR−/− groups that were significantly different from those in the NPC+/+/LDLR+/+ animals. The dagger (†) indicates those values in the NPC−/−/LDLR−/− mice that were significantly different from those in the NPC−/−/LDLR+/+ groups.

