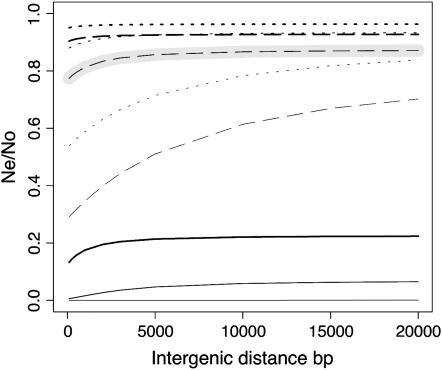
Figure 8.—
Longer intergenic distances reduce background selection in a region. This plot shows the fixed selection coefficient prediction for the mean B of a focal gene with varying intergenic distances, when five neighboring genes are located on both sides (with features as in Figure 5) and rg = 2.5 × 10⁻⁶. Other features of the curves are as in Figure 3.

