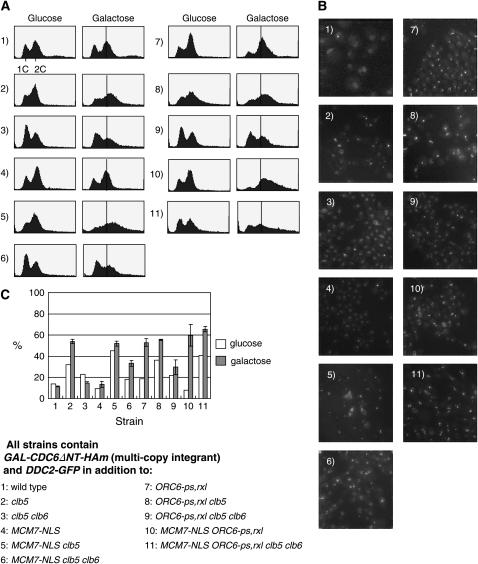
Figure 2.—
Induction of DNA rereplication and recruitment of Ddc2-GFP foci. (A) Cells were grown in YEP-D and transferred to YEP-R for 8 hr. Galactose at the final concentration of 3% was added for 4 hr. Cells were fixed and DNA content was measured by DNA flow cytometry analysis. The approximate position of 2C DNA content was determined on the basis of the major 2C peak in the control (1; GAL-CDC6ΔNT-HAm strain). This position is indicated by a bar. All samples were processed in parallel, and data were collected using the same set up (voltage 780 and total cell number 20,000 cells) and gating. As a rough empirical guide, we consider the DNA flow cytometry profile to represent over-replication if the main peak is shifted rightward compared to the bar. Each histogram is numbered on the basis of the strain numbering in Figure 1B. (B) The same strains, numbered as in A, were induced with galactose for 4 hr, and cells were observed under a DeltaVision microscope. Image stacks were deconvolved and processed at maximum projection. (C) Percentages of the cells showing DDC2-GFP foci in the presence of glucose or galactose. At least 100 cells were counted for each experiment, and three experiments were repeated. Average number and standard deviation were plotted. Open bars show percentages of DDC2-GFP foci when incubated in glucose, and shaded bars show the same when incubated in galactose.

