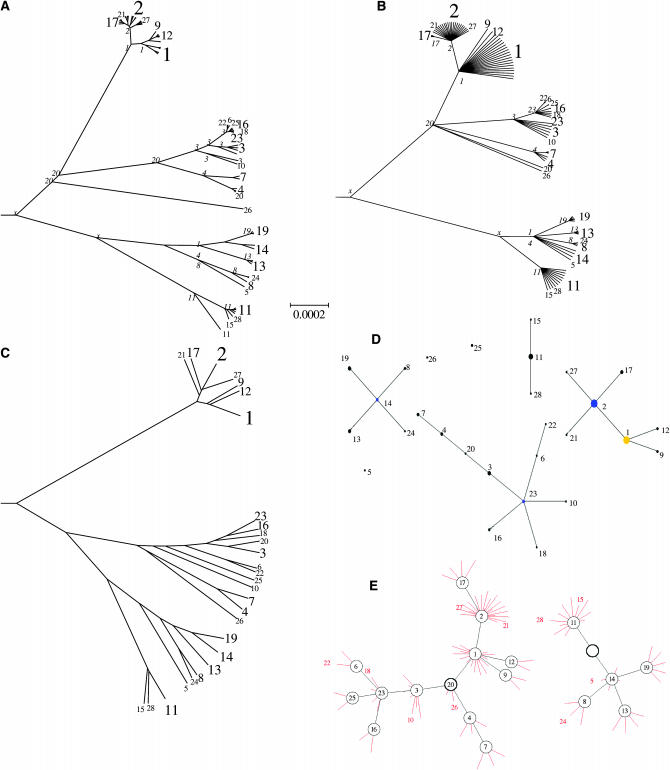
Figure 3.—
Application to simulated MLST data. (A) The true clonal genealogy; (B) the genealogy inferred by our program; (C) a UPGMA tree. The genealogies were drawn using the radial tree option of Mega (Kumar et al. 2001) and share a common scale. STs of internal nodes are indicated in italics in A and B, with x indicating an ST that does not occur in the sample. STs are indicated in regular type, with the size of the font approximately proportional to the number of strains represented. (D) The output of eBURST; (E) a network representation of our output using Graphviz (Gansner and North 2000). The network shows inferred ancestral nodes in black and the location of isolates in red, with each red line indicating a single isolate. Each isolate has the genotype of the node it is connected to, unless otherwise indicated. Nodes whose ST is not found among isolates are shown as an empty circle. The ancestral node of each network component is indicated by a thicker circle.

