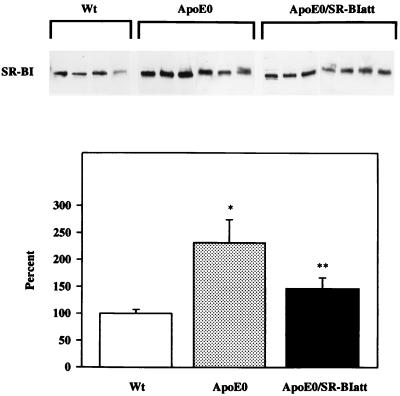
Figure 2.
Western blot analysis of SR-BI expression in liver. (Upper) Immunoblots obtained for individual mice (30 μg of total protein per lane). (Lower) Arbitrary units of mass determined by densitometric scanning, relative to wt mice (100%). Statistical significance: ∗, P < 0.001 compared with wt; ∗∗, P < 0.05 compared with wt and apoE0 mice. Similar results were obtained after normalization of the SR-BI signal for tubulin expression.

