Figure 3.
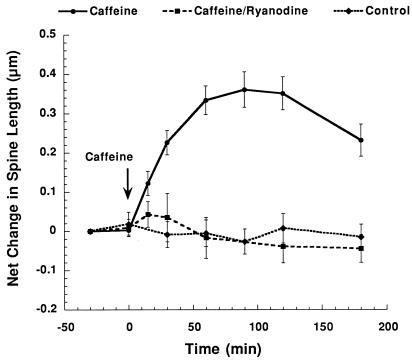
Time course of effects of caffeine on dendritic spines in culture. Shown is a summary diagram of changes in dendritic spines in control condition (n = 36 spines), after exposure to caffeine (n = 107 spines), and in response to caffeine in the presence of ryanodine (n = 13). A significant change in spine length is seen within 30 min of caffeine treatment whereas no change is seen in either control or in the presence of ryanodine.

