Figure 1.
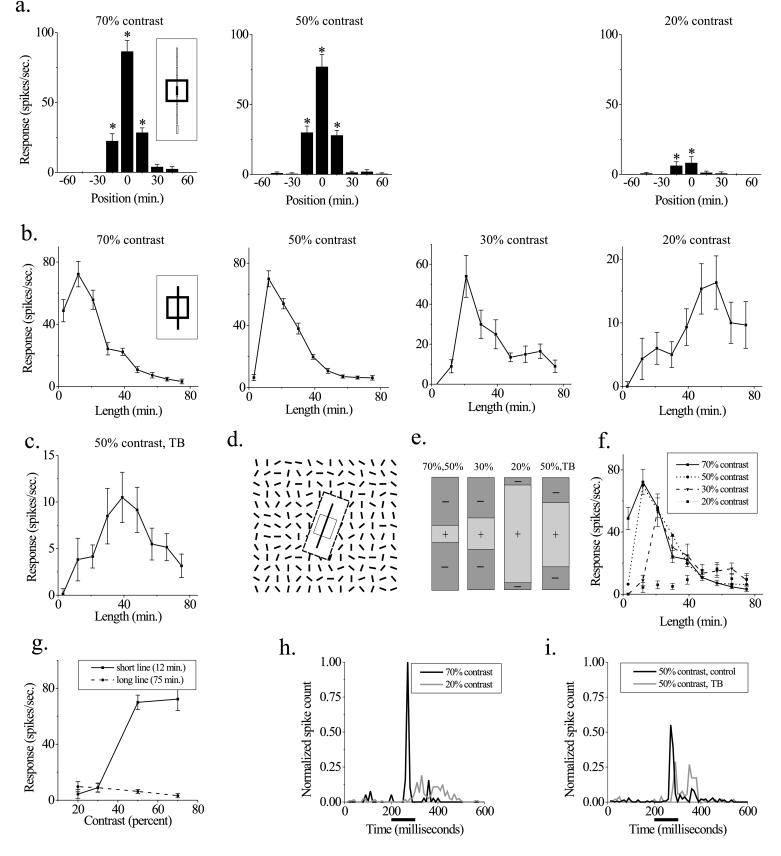
The dimensions of V1 receptive fields are stimulus-dependent. (a) Minimum response field (MRF) measurements. Neuron responses to a small bar (measuring 15′ × 3′) were measured at adjacent positions along the orientation axis of the RF (Inset) at three different contrasts (Left, 70%; Center, 50%; and Right, 20%). Significant responses (P < 0.01, t test) are indicated by an asterisk. RF size is defined as the center-to-center distance between the outermost significant points, or 30′ for the two higher contrasts and 15′ for the lowest contrast. (b) Length-tuning measurements in these four panels show the neuron’s responses to optimally oriented bars of different lengths and 3′ wide, presented at the RF center at four different contrasts. The extent of the excitatory RF is defined as the stimulus length that produces the maximal response at each contrast. The neuron shows spatial summation over a region 5-fold larger at low contrasts than at high contrasts. Note that the change in RF size is in the opposite direction to that observed in a. (c) Length-tuning measurements in a textured background (TB). The stimulus is described in d. The background stimulus causes a suppression in the response to the bar stimulus and enhances spatial summation, even though the local contrast of the bar is still 50% (compare with 50% contrast condition in b). Response to background stimulus alone is 0.8 ± 1.2 spikes/sec. (d) Schematic of the textured background stimulus used in e. A 5° × 5° array of randomly oriented lines surrounds the RF (each bar measures 15′ × 3′ and RF is depicted as an open square), whereas an optimally oriented bar is presented at different lengths at the center of the RF. To keep the surround stimulus from eliciting a response on its own, the display is masked over a region larger than the RF by a black rectangle (here shown as a white rectangle bounded by dashed lines). (e) Schematic summary of the changes in size of excitatory and inhibitory RF subregions under different stimulus conditions. Plus symbols (+) represent excitatory subregions and minus symbols (−) represent inhibitory subregions. As stimulus contrast is decreased, the excitatory region becomes larger and the inhibitory flanks become smaller. Embedding a high-contrast stimulus in a textured background produces changes similar to those produced by lowering its contrast. (f) Curves from b are overplotted to show the convergence of curves at long line lengths. (g) Responses at two different line lengths are plotted as a function of stimulus contrast. For the short line, the neuron’s response increases with contrast, but for the long line, the response is contrast-independent. (h and i) The temporal profile of responses to long lines under different stimulus conditions. The neural responses to the four longest line lengths from f were summed and normalized to obviate small differences in their overall firing rates. (h) Comparison of high and low contrasts. Although the average firing rate is similar under these two conditions, the shapes of the curves are quite different. The bar below the x axis denotes the time over which the stimulus is presented. (i) Comparison of control and textured background conditions at the same contrast. A shift occurs in the position of the spikes from the early to the late part of the response. Spike rates are normalized as in h and displayed at the same scale.

