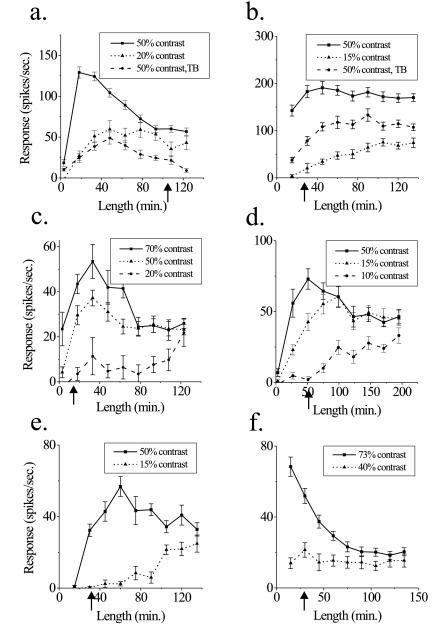
Figure 2.
Changes in RF dimensions are consistent over the population of cells. (a–f) Length-tuning relationships for bar stimuli for different cells are compared with minimum response measurements of RF size at high contrast (indicated by arrows on y axis). Almost every cell showed a similar trend toward increased spatial summation at low contrasts. Response to background stimulus alone is −1.1 ± 0.8 spikes/sec in a and 33.1 ± 4.7 spikes/sec in b.

