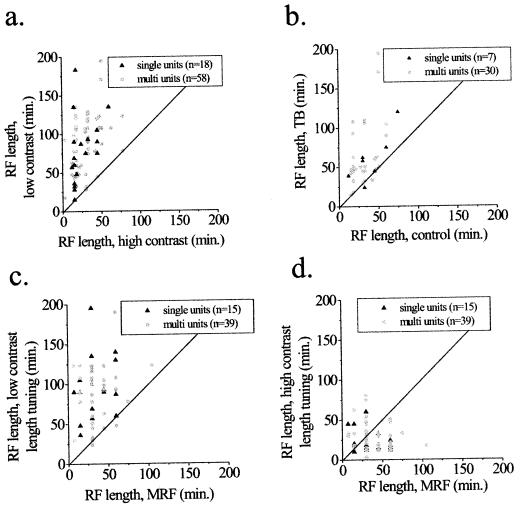
Figure 3.
Population analysis of changes in RF dimensions. Each point in the graphs represents the results of one recording site from either a single unit or a multiunit cluster. The unity lines indicate the expected position of all points if there were no change in RF characteristics. (a and b) Comparison of RF length, as measured by the peak response of length-tuning curves under different stimulus conditions. (a) The length of the RF is plotted as a function of the highest and lowest contrasts tested for each cell. (b) Comparison of RF length between a high-contrast bar alone and one embedded in a textured background. The contrast of the stimulus in the RF is the same in both conditions. Note the consistency of the results in a and b. (c and d) Comparison of RF length measured by length-tuning curves at different contrasts and the MRF obtained at high contrast. (c) At low contrasts, length-tuning measures produce a larger measure of RF size than that of the MRF. (d) The relationship between these two measures of length varied more at high contrasts; but over the population of cells, a trend emerged for length-tuning curves to produce smaller measures of RF length than those of the MRF.

