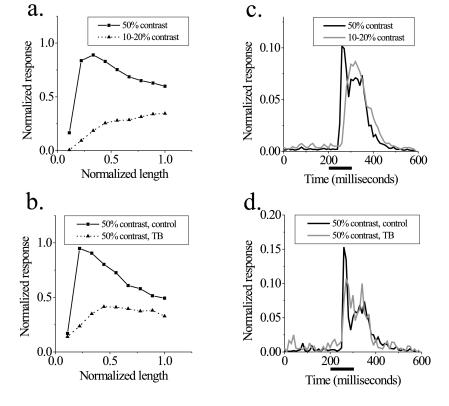
Figure 4.
Analysis of the population of length-tuning curve shapes and temporal response properties. (a) Comparison of high and low contrasts. The high-contrast curve reaches a peak at short line lengths and decreases as line length increases, whereas the low-contrast curve shows length summation over the entire range. For short lines, the difference in the response to the two contrasts is great, but the tuning curves tend to converge at longer line lengths, and this difference is greatly reduced. (b) Comparison of control and textured background conditions at 50% contrast. We subdivided the population of cells into three categories based on the magnitude of surround suppression. The one-third with the greatest surround suppression is shown. Surround suppression forces cells to behave as if they were at a lower contrast, and the extent of spatial summation increases. Similar to the comparison of low and high contrasts, the difference in response to the two conditions is greatest for short lines and smaller as line length increases. Note that this population of neurons shows more end inhibition than the general population. (c and d) Comparison of temporal responses. The temporal structure of neural responses is compared for the longest line lengths in a and b, respectively. (c) Comparison of high and low contrasts. In the high-contrast condition, a sharp peak of activity is followed by a smaller sustained response. At low contrast, the response is more uniform with a longer latency. The area under the curves is normalized to eliminate the difference in overall response rate. (d) Comparison of control and textured background conditions at the same contrast. A shift occurs in the positions of spikes from the early to the late part of the response, but latency does not change.

