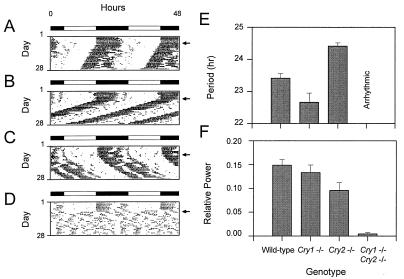
Figure 3.
Effects of disruption of the Cry genes on circadian locomotor activity rhythms. (A–D) Wheel-running activity records of individual mice, double-plotted according to convention so that each day’s data are represented both to the right and beneath that of the preceding day. Times of activity are represented by black. The animals were kept on a LD12:12 cycle as indicated by the bar above each record and then transferred to constant darkness by allowing lights to go off at the usual time on the day, indicated by an arrow on the right. (A) Activity record of a wild-type mouse. (B) Activity record of a Cry1−/− mouse. (C) Activity record of a Cry2−/− mouse. (D) Activity record of a Cry1−/−Cry2−/− mouse. (E) Effects of disruption of the Cry genes on circadian period. The free-running period was estimated by χ2 periodogram from days 1–20 in DD. Means and SEM of each genotype are illustrated. Sample sizes (N) are as follows: wild-type, n = 6; Cry1−/−, n = 5; Cry2−/−, n = 10; Cry1−/−Cry2−/−, n = 4. None of the double homozygotes exhibited significant circadian periodicity and, hence, no period estimates are shown. (F) Loss of circadian rhythmicity was assessed by Fourier analysis. Data from days 1–20 in DD were analyzed by fast Fourier transform (FFT), and power spectral densities for frequencies ranging from 0 to 1 cycles/hr were determined and normalized to a total power (area under the curve) of one. The resultant relative power value peak in the circadian range (18- to 30-hr period or 0.033- 0.055 cycles/hr) was determined for each animal for comparison. The means and SEM of circadian peak values of relative power are plotted for each genotype. Sample sizes are the same as in E.

