Figure 2.
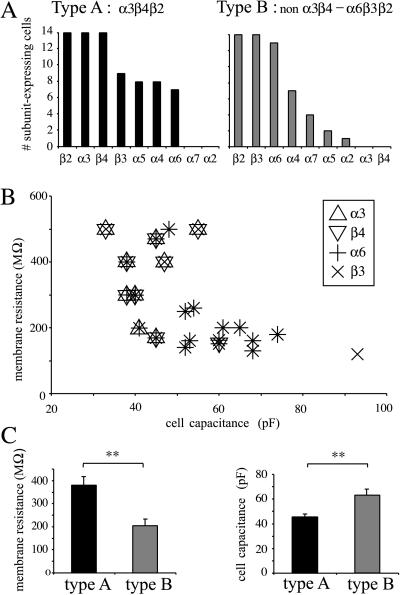
Difference in electrical characteristics of LC neurons in two populations distinguished by their expression pattern. (A) Pattern of expression of the nAChR subunits in the two populations of LC neurons. (B) Pattern of expression of nAChR subunits in neurons when both the cell capacitance and the membrane resistance have been measured. Note the frequent association of α6 and β3 (star symbol) and of α3 and β4 (superimposition of large, empty symbols), as well as the segregation of these last subunits in neurons with large membrane resistance and small capacitance. (C) Average membrane resistance and capacitance in types A and B neurons (∗∗, P < 0.01).

