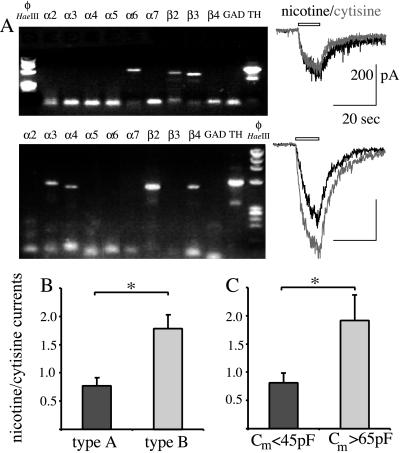
Figure 3.
Difference in the pharmacological profile of LC neurons in relation with the subunits they express. (A) Agarose gel electrophoresis of the RT-PCR products from two cells with different expression patterns (Left) and electrophysiological responses in the same cells to the application of 10 μM nicotine or cytisine (Right). Transcripts for subunits α6, β2, and β3 are detected in the first cell (type B), and nicotine elicits larger currents than cytisine. Transcripts coding for subunits α3, α4, β2, and β4 are detected in the second cell (type A), and nicotine elicits smaller responses than cytisine. The faint band in the TH lanes corresponds to nonspecific amplification. (B) Ratio of current amplitude elicited by 10 μM nicotine and cytisine in types A and B neurons (see text); P = 1.85 × 10⁻². Nicotine elicits larger currents than cytisine in type A neurons whereas the reverse is true in type B neurons. (C) Ratio of current amplitude elicited by 10 μM nicotine and cytisine in a separate set of cells (for which the expression pattern is unknown) divided in two groups with respectively small and large membrane capacitance. The same difference as types A and B neurons is observed between small and large capacitance neurons (P = 1.0 × 10⁻²); ∗, P < 0.05.

