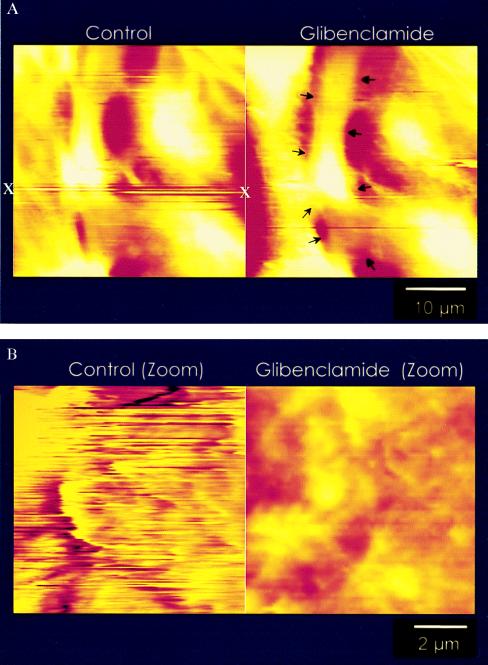
Figure 4.
Control scans of S9 cells with a functionalized AFM tip. (A Left) One “hot spot” of extracellular ATP (x) is clearly visible and reproducible over a time period of at least 30 min. These ATP pools are detectable as long streak lines (see x) at distinct locations along the surface of the cells in culture. The appearance of lines rather than points of deflections is caused by the rate of scanning (1–2 scan lines per s). The AFM tip first dips into a localized ATP pool and then moves away from this area as the scan progresses. As ATP hydrolysis occurs, a positive deflection of the tip is noted (illustrated in Fig. 1) causing a continuous line of activity. (A Right) The same cells after incubation with 10−4 M glybenclamide, a known inhibitor of CFTR. Note the reduction in hot spots (arrows), indicative of a reduction of extracellular ATP concentration. (B Left) High-resolution scan of a hot spot. Because of the localized ATP signal, the surface morphology of the cell is almost invisible. With increasing ATP levels at the cell surface, ATP hydrolysis by the S1 subfragment causes continuous deflections of the tip. The increased deflections caused by localized areas of high ATP activity reduce the ability to obtain the cell surface morphology. (B Right) For comparison, a cell after an incubation with 10−4 M glybenclamide.

