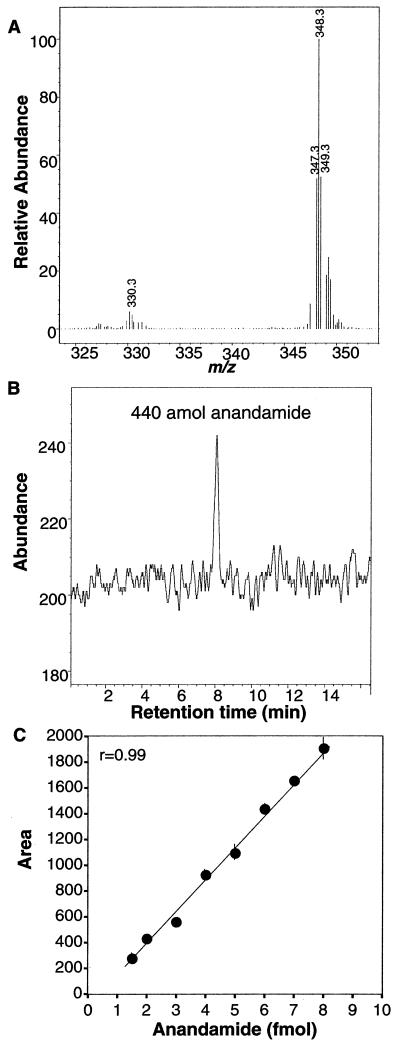
Figure 2.
Sensitive, precise measurement of anandamide was performed with LC/APCI MS. (A) The mass spectrum reflects the minimal fragmentation as desired for maximal sensitivity; the spectrum shown mainly represents the distribution of naturally occurring anandamide M+ isotopes around the major peak at 348.3. The minor peak at 330.3 is identical to the mass of anandamide minus water. The data are in excellent agreement with spectra obtained by Koga et al. (18). (B) Detection of 440 amol of anandamide. This method was developed by using a Hewlett Packard 1100 series mass selective detector in selected ion monitoring mode at molecular weight 348.3, that of the principal anandamide M+ isotope (23). (C) Synthetic anandamide analyzed by APCI-LC/MS with the parameters described. The response, assessed by peak area, was linear over at least four orders of magnitude. Shown are anandamide levels from 1.5 to 8.0 fmol (in 10-μl volumes), covering the range measured in microdialysis samples. Although the range was restricted, the response was highly linear as determined by regression analysis. The points shown represent means of three samples, and the vertical bars represent SEMs.

