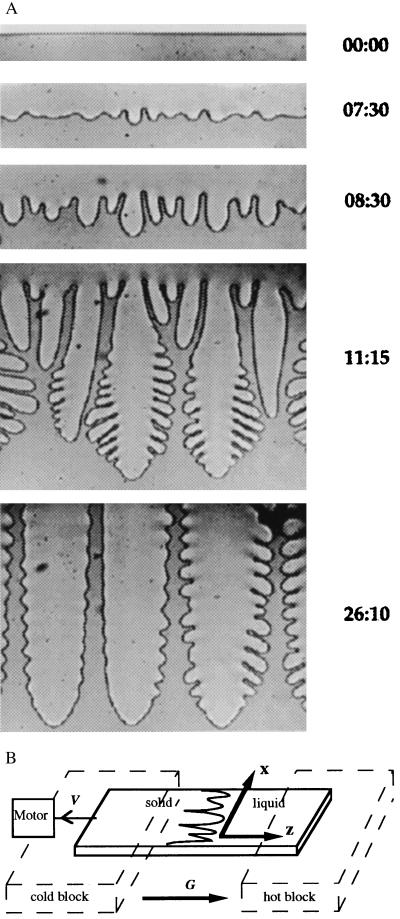
Figure 2.
(A) Time evolution of the interface morphology for SCN/rhodamine 6G at constant pulling speed V (V = 3.11 μm/s, G = 2.8 K/cm, C∞ = 0.325 wt%). From Top to Bottom: stationary planar interface, cellular pattern at the crossover time, onset of nonlinear instabilities, coarsening phase, and steady-state dendritic array. Elapsed time (in minutes:seconds) from the initiation of pulling is shown at the right. (B) Schematic drawing of the directional solidification experiment. The (thin) sample is moved through the temperature gradient at pulling speed V while the crystal–melt interface remains nearly fixed in the laboratory reference frame.

