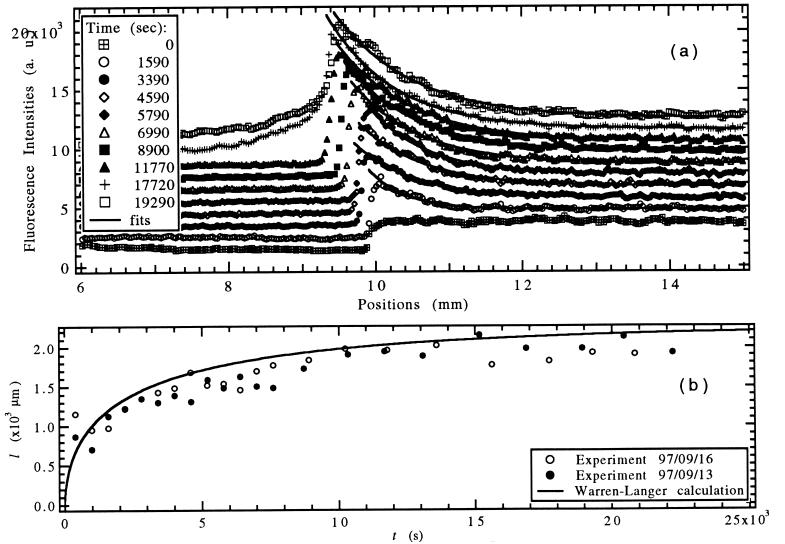
Figure 5.
(a) Experimentally observed solute concentration profile of SCN/C152 evolving with time after initiation of pulling with V = 0.44 μm/s, G = 15 K/cm, C∞ = 0.3 wt% (symbols). Exponential fits to the data are shown as solid lines. (b) Diffusion length l(t) for two experiments obtained from exponential fits (symbols) and from the WL calculation with V = 0.44 μm/s (solid line).

